Pollen Chart
Explore the history of our environment
The study of pollens found in sediments at the bottom of lakes, deposited slowly one layer on top of the others over millenia, is a tremendous source of informations about prehistorical changes of vegetation and climate.
Since 2007, thousand of scientists have been sharing data from hundred of thousands of samples in the European Pollen Database, free of charge, for the scientific community.
This website is dedicated to help exploring this invaluable trove of our past, for a better understanding of our environment and our future.
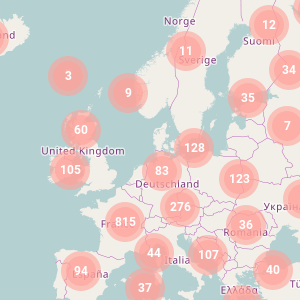
Thousands of sites in Europe
As of March 2017, there are 2409 sites in the database.
Most sites cover a good part of the Holocene, up to the last glaciation, and some even go hundreds of years in the past.
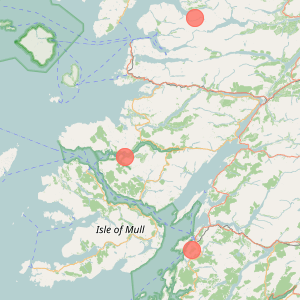
Mapped with great accuracy
Every site of the database is published along with its precise geographical location and a description of the surrounding.
Pollen Chart displays the sites on an interactive map allowing easy access to the data.
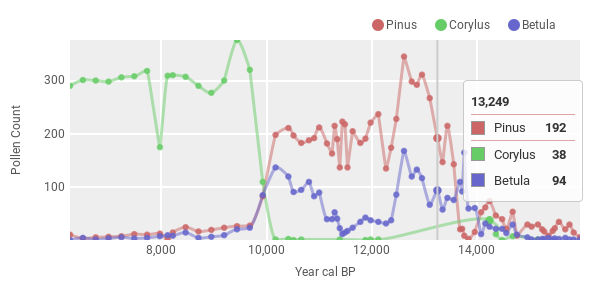
Interactive pollen count charts
Once a site is selected, a full screen chart of pollen count is generated. The chart is interactive and provides the tools to extract and compare precisely the data.
Pollen Chart is open source and use modern web frameworks to be as fast and easily extensible as possible. Read more about the technical stack on GitHub.